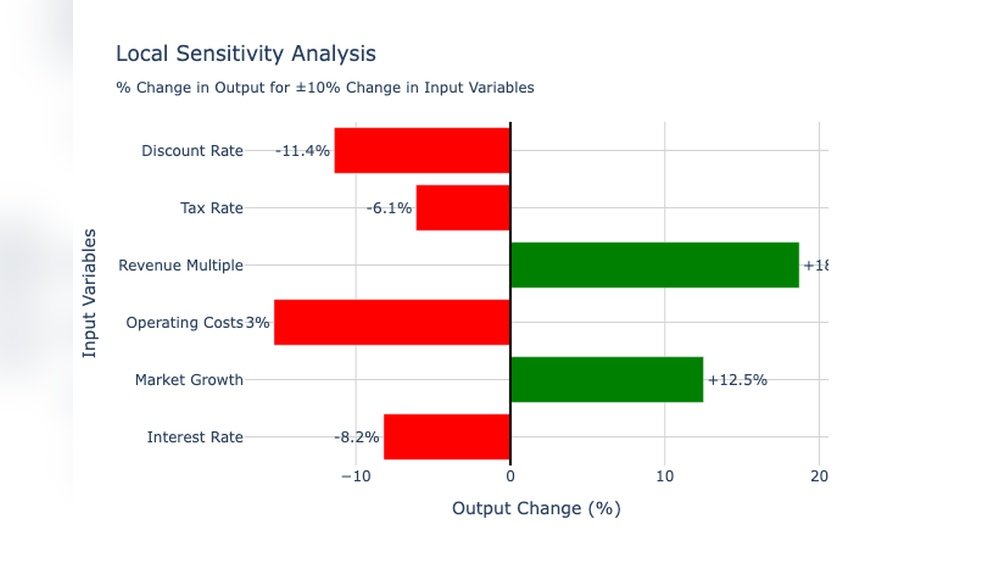
If you run an online store, you probably spend money on ads. Ads help more people find your products. But how much should you spend? What happens if you spend a little more or less? This is where ad spend sensitivity analysis comes in. It helps you see how changes in ad spending affect your sales and profits.
What Is Ad Spend Sensitivity Analysis?
Ad spend sensitivity analysis is a way to check how your sales change when you change your ad budget. You try different ad spend amounts. Then, you watch what happens to your sales or profit. This study shows which ad spend amount works best for your store.
For example, if you spend $100 on ads this week and make $500 in sales, what if you spend $150? Will sales grow to $700? Or will it stay the same? Sensitivity analysis answers these questions.
Why Is It Important for E-Commerce?
In e-commerce, ads are one of the biggest costs. You want to spend money wisely. Too little ad spend means fewer customers. Too much means you might lose money. Sensitivity analysis helps find the right balance.
Without this analysis, you might guess how much to spend. Guessing can lead to wasted money or missed chances. With analysis, you use facts and data to decide.
How to Do Ad Spend Sensitivity Analysis
You can do this analysis in a few simple steps. It does not need complex tools. You can even use a spreadsheet.
Step 1: Collect Data
First, gather your ad spend and sales data. Use numbers from past weeks or months. For example, write down how much you spent on ads each week. Then write how much you sold in those weeks.
Step 2: Create A Table
Put your data in a table. This helps you see patterns. Here is a simple example:
| Ad Spend ($) | Sales ($) | Profit ($) |
|---|---|---|
| 50 | 200 | 100 |
| 100 | 400 | 250 |
| 150 | 550 | 300 |
| 200 | 600 | 280 |
This table shows ad spend, sales, and profit. Profit is sales minus ad spend and other costs.
Step 3: Analyze The Changes
Look at how sales and profit change when ad spend changes. See if sales go up or down. Check if profit grows or shrinks.
For example, in the table above, sales increase as ad spend grows. But profit grows only up to $150 ad spend. After that, profit drops even if sales rise. This means spending more than $150 might not be good.
Step 4: Make Decisions
Use the information to choose your ad budget. Pick the amount where profit is highest. In our example, $150 is the best spend.
Benefits of Ad Spend Sensitivity Analysis
- Save Money: Avoid spending too much on ads that don’t help.
- Increase Profit: Find the sweet spot for spending that makes more profit.
- Understand Customers: Learn how ads affect your buyers.
- Plan Better: Use data to plan future ad budgets.
Challenges You May Face
This analysis is helpful but not perfect. Here are some challenges:
- Data Quality: If your sales or ad data is wrong, analysis is wrong.
- External Factors: Sales can change due to season or events, not just ads.
- Time Lag: Sometimes ads take time to show results.
- Complex Markets: Many things affect sales, not only ads.
Keep these in mind when you do your analysis. Use it as a guide, not a rule.
Tools You Can Use
You don’t need expensive software. Simple tools can help you analyze ad spend and sales.
- Spreadsheets: Google Sheets or Microsoft Excel work well.
- Analytics Platforms: Google Analytics can show ad performance.
- Ad Platforms: Facebook Ads or Google Ads give reports.
- Basic Calculators: For quick profit and margin checks.
Examples of Ad Spend Sensitivity Analysis
Let’s look at some simple examples to understand better.
Example 1: Small Online Shop
A small store sells handmade bags. They spend $50 on ads and make $150 in sales. Next week, they spend $75 and sales rise to $200. When they spend $100, sales stay $200. The owner sees that spending over $75 does not increase sales. So, $75 is the best ad spend.
Example 2: Electronics Store
A bigger store sells phones. It spends $500 on ads and earns $2000. Spending $700 increases sales to $2500. But profit is lower because ad costs are high. Sensitivity analysis shows the store should spend $500 to keep profit high.
Tips for Better Analysis
- Track Regularly: Collect data often, like weekly.
- Use Clear Metrics: Focus on sales and profit, not just clicks.
- Consider Other Costs: Include shipping and product costs.
- Test Changes: Change ad spend slowly to see effects.
- Look for Patterns: Check if some ad types work better.
Frequently Asked Questions
What Is Ad Spend Sensitivity Analysis In E-commerce?
Ad spend sensitivity analysis measures how changes in ad budget affect sales. It helps identify the best spending level for profit. This method shows which ads bring the most value.
Why Is Ad Spend Sensitivity Important For Online Stores?
It helps online stores spend money wisely on ads. Understanding sensitivity avoids wasting money on ineffective ads. Stores can improve sales by adjusting budgets properly.
How Do You Conduct Ad Spend Sensitivity Analysis?
Track sales against different ad budget levels over time. Use data to see which budget changes increase or decrease sales. Compare results to find the optimal spending point.
What Metrics Matter In Ad Spend Sensitivity For E-commerce?
Focus on return on ad spend (ROAS) and conversion rates. Also, monitor cost per acquisition (CPA) and total revenue. These metrics show ad efficiency and impact on profits.
How Often Should E-commerce Businesses Analyze Ad Spend Sensitivity?
Regular checks, like monthly or quarterly, work best. Market trends and consumer behavior change, so frequent reviews keep strategies updated. Consistent analysis helps adjust budgets effectively.
Can Ad Spend Sensitivity Analysis Improve Marketing Roi?
Yes, it helps allocate budget to the most effective ads. By understanding ad impact, businesses avoid overspending on low performers. This leads to better return on investment.
Conclusion
Ad spend sensitivity analysis helps e-commerce stores spend money wisely. It shows how sales and profit change with ad budgets. By checking different ad spends, you find the best amount to spend. This saves money and improves profit.
Remember, the goal is to use data, not guess. Keep learning from your store’s numbers. This way, your ads can help your business grow step by step.

About the Author
Oliver K.G.
Oliver K.G. has 8+ years in pricing strategy and has helped 200+ Amazon FBA sellers, dropshippers, and small business owners optimise their profit margins. He built BizMargin to make gross margin and pricing calculations instant and free. He writes on pricing strategy, gross margin optimisation, and profitability for e-commerce and retail businesses.