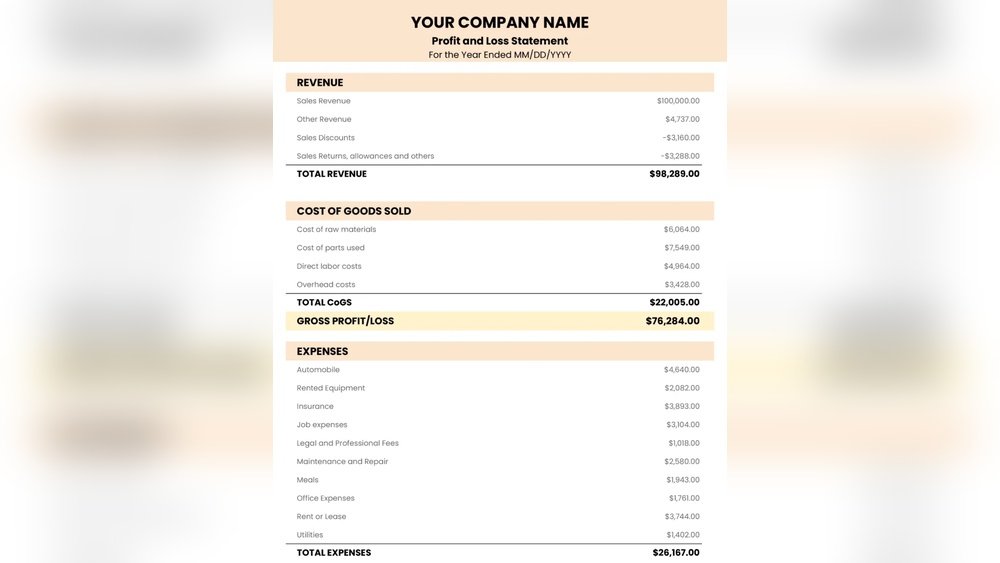
Are you looking to get a clear picture of how your business is performing so far this year? Understanding your Year To Date Profit and Loss Statement is the key.
This simple report shows your income, expenses, and overall profit from the start of the year up to today. Knowing how to read and use this statement can help you make smarter decisions, spot problems early, and plan for growth.
Keep reading, and you’ll discover exactly how to unlock the power of your financial data to boost your business success.
Basics Of Year To Date P&l
A Year To Date Profit and Loss (P&L) statement shows your company’s financial results from the start of the year to today. It helps track income and expenses over a specific time. This report offers a clear picture of business performance so far this year.
Businesses use the Year To Date P&L to compare current results with past periods. It guides decisions on spending, saving, and investment. Understanding the basics of this report is important for managing finances well.
What Is A Year To Date P&l Statement?
This statement summarizes all income and expenses from January 1 to the current date. It shows total revenue, costs, and profits or losses. The report updates regularly as new transactions occur.
Why Use A Year To Date P&l?
It helps track how the business performs throughout the year. You see trends and patterns in income and spending. The report supports better budgeting and financial planning.
Key Components Of A Year To Date Pl
Income: All money earned from sales or services.
Expenses: Costs like salaries, rent, and materials.
Net Profit or Loss: The difference between income and expenses.
How To Read The Report
Look at total income to see earnings so far. Check expenses to understand where money goes. Finally, the net profit or loss shows if the business made money or lost it.
Key Components
The Year To Date (YTD) Profit and Loss statement shows your business’s financial health. It tracks money earned and spent from the year’s start to now. Understanding its key parts helps you see how well your business performs.
Revenue
Revenue is the total money your business earns. It includes sales of products or services. This number shows how much income your business generates before costs.
Expenses
Expenses are the costs to run your business. They include rent, salaries, and materials. Tracking expenses helps control spending and improve profits.
Net Profit
Net profit is what remains after subtracting expenses from revenue. It shows your business’s actual earnings. A positive net profit means your business makes money.
Preparing The Statement
Preparing a Year To Date Profit and Loss (P&L) statement helps track your business’s financial health. This statement shows income and expenses over the current year. It highlights profits or losses up to the report date. Creating this statement requires careful steps. Each step ensures accurate and clear financial information.
Data Collection
Start by gathering all financial records. Collect sales receipts, invoices, and expense reports. Include bank statements and payroll data. Ensure the data covers from January 1st to the current date. Check for missing or incorrect entries. Organize the data by date and type. Accurate data is the base for a reliable P&L statement.
Calculations
Add all income sources for the year to date. Sum up total sales, service income, and other revenues. Next, total all expenses. Include rent, utilities, salaries, and supplies. Subtract total expenses from total income. The result shows your net profit or loss. Double-check calculations to avoid errors.
Formatting
Present the data clearly and neatly. Use rows for income and expense categories. Show totals at the bottom of each section. Highlight the net profit or loss at the end. Use simple fonts and avoid clutter. Keep the layout consistent for easy reading. A well-formatted statement aids quick understanding.
Analyzing Performance
Analyzing performance in a Year To Date (YTD) Profit and Loss Statement helps businesses understand their financial health. This analysis shows how well the company is doing over time. It highlights areas of strength and points out where improvements are needed. Clear insights come from looking at trends, variance, and benchmarks.
Trends
Trends reveal patterns in income and expenses across months. Rising sales or growing costs show clear trends. These trends help predict future results. They also guide budgeting and planning. A positive trend in profits means the business is on track. Negative trends warn of potential problems early.
Variance Analysis
Variance analysis compares actual results to budget or past data. It shows differences between expected and real numbers. Identifying large variances helps find causes quickly. These might be due to market changes or internal issues. Fixing problems or adjusting plans improves financial control. Variance analysis keeps business goals realistic and achievable.
Benchmarking
Benchmarking compares your performance to similar businesses or industry standards. It shows if your profits and costs are normal or unusual. This helps set realistic targets and measure success. Benchmarking also reveals competitive strengths and weaknesses. It encourages better financial decisions and strategy adjustments.
Common Challenges
Year to Date Profit and Loss Statements help track business performance. They show earnings and expenses over several months. Many businesses face common challenges while preparing these reports. These challenges can affect the accuracy and usefulness of the statement.
Data Accuracy
Accurate data is crucial for reliable statements. Errors in numbers can mislead decision makers. Mistakes often happen during data entry or calculation. Small errors can grow and cause big problems. Regular checks are needed to keep data correct.
Timing Issues
Timing affects how income and expenses appear in reports. Transactions must be recorded in the right period. Delays in recording can distort financial results. Matching income with related costs is important. Proper timing shows the true financial picture.
Adjustments
Adjustments fix errors and update records for accuracy. They include correcting entries and accounting for depreciation. Without adjustments, statements may not reflect reality. Adjustments help show the real profit or loss. Careful review ensures all changes are included.
Using Ytd P&l For Decisions
The Year To Date Profit and Loss (YTD P&L) statement shows your business’s financial results so far this year. It helps you see how much money you made and spent. Using this data supports smart decisions. It gives a clear picture of your current financial health. You can plan better and avoid surprises.
Budgeting
The YTD P&L helps create an accurate budget. It shows actual income and costs up to today. You can compare these numbers to past budgets. This helps spot areas where you spend too much or save more. Adjusting your budget based on real data keeps your money in control.
Forecasting
Use the YTD P&L to predict future profits and losses. It shows trends in sales and expenses. These trends help estimate what might happen next months. Forecasting helps prepare for slow periods or busy times. It guides you in setting realistic sales and expense goals.
Strategic Planning
Strategic planning depends on clear financial information. The YTD P&L reveals strengths and weaknesses in your business. Knowing this helps choose where to grow or cut costs. It supports long-term decisions, like hiring staff or buying equipment. Using YTD data keeps your plans practical and focused.
Frequently Asked Questions
What Is A Year To Date Profit And Loss Statement?
A Year To Date Profit And Loss Statement summarizes income and expenses from the start of the year to now. It shows overall business profitability and helps track financial performance over time.
How Does A Ytd Profit And Loss Statement Help Businesses?
It provides a clear view of earnings and costs year-to-date. This helps businesses make informed financial decisions and identify trends or issues early.
What Key Components Are In A Ytd Profit And Loss Statement?
Main components include total revenue, gross profit, operating expenses, and net profit. These figures reflect the company’s financial health over the year.
How Often Should Businesses Review Their Ytd Profit And Loss?
Businesses should review it monthly or quarterly. Frequent reviews ensure timely adjustments and improved financial planning throughout the year.
Conclusion
A Year To Date Profit and Loss Statement shows your business’s financial health. It helps track income and expenses clearly. You can spot trends and make smart choices fast. Regularly checking this statement keeps your goals in sight. It also prepares you for taxes and future planning.
Stay consistent and review your numbers often. This simple step supports better money management. Keep your business strong and growing steadily.

About the Author
Oliver K.G.
Oliver K.G. has 8+ years in pricing strategy and has helped 200+ Amazon FBA sellers, dropshippers, and small business owners optimise their profit margins. He built BizMargin to make gross margin and pricing calculations instant and free. He writes on pricing strategy, gross margin optimisation, and profitability for e-commerce and retail businesses.